REPORTING OVERVIEW · NO CLIENT FIGURES SHOWN
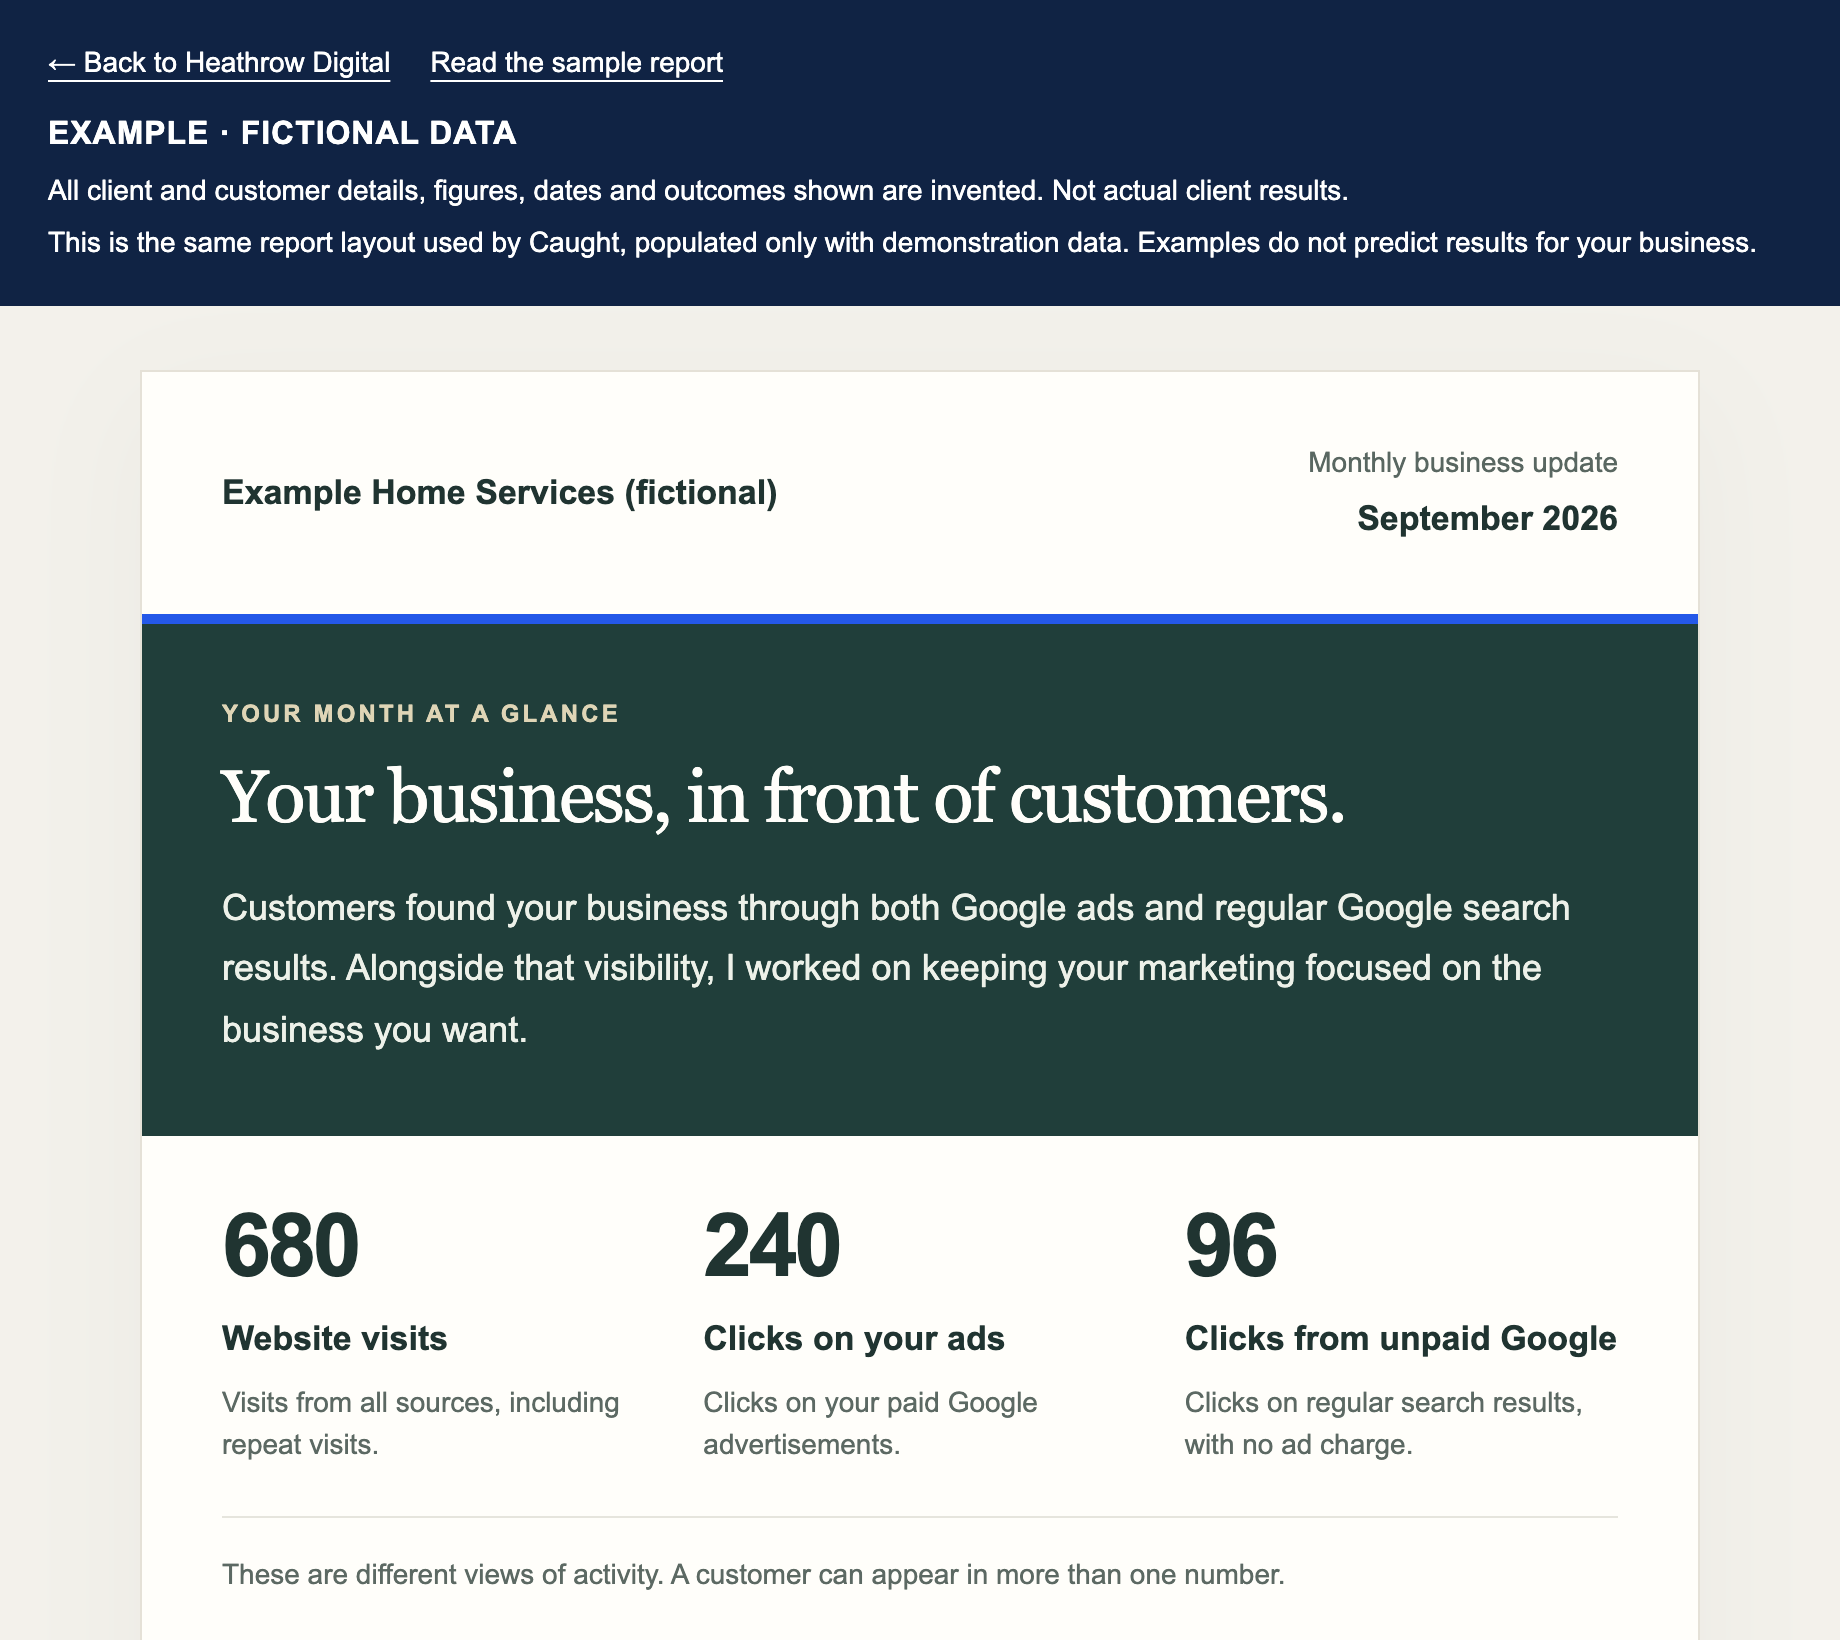
Your month at a glance.
The detail behind it.
Open a section to see what your business update can show.
Your spending, explained
See how much of your planned ad budget was spent, the average cost per click and cost per recorded ad inquiry when tracking supports it. Month-to-month comparisons show how spending and clicks changed, so you have context for the figures.
The searches & campaigns behind the clicks
See the top search phrases Google disclosed and which campaigns brought ad clicks, with campaign spending and cost per click. This helps us discuss the services attracting interest and the searches that need closer attention.
What each location costs
City-level detail can include ad clicks, spending in dollars and cents, average cost per click, ad appearances and Google-reported conversions. Where available, you can also see the cost per Google conversion. Locations are Google’s estimates, and its conversions are kept distinct from confirmed inquiries.
Forms submitted. Phone numbers tapped.
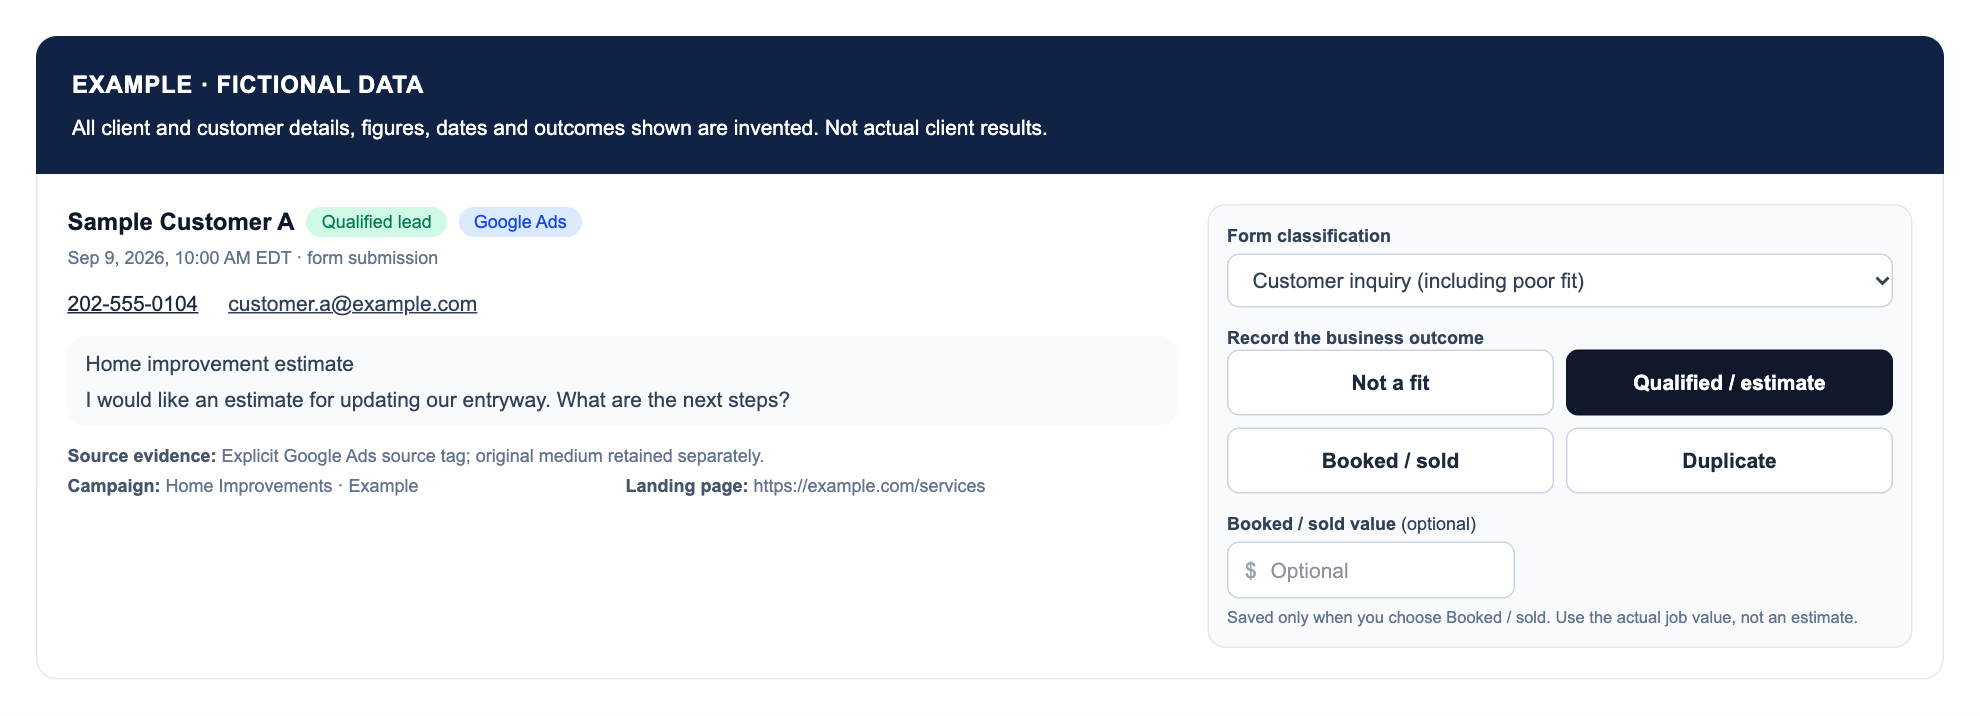
See recorded website form inquiries alongside phone and text-link interactions. Phone taps show intent to call, not confirmed conversations. Completed calls appear separately when call tracking is connected. Inquiries attributed to ads are distinguished from other recorded website inquiries.
Paid ads & unpaid Google visibility
Your update distinguishes overall website visits, paid ad clicks and clicks from regular Google search results. Unpaid search appearances show how often your website was seen without an ad charge. These measures stay separate because the same customer can appear in more than one.
ChatGPT visits, down to the page
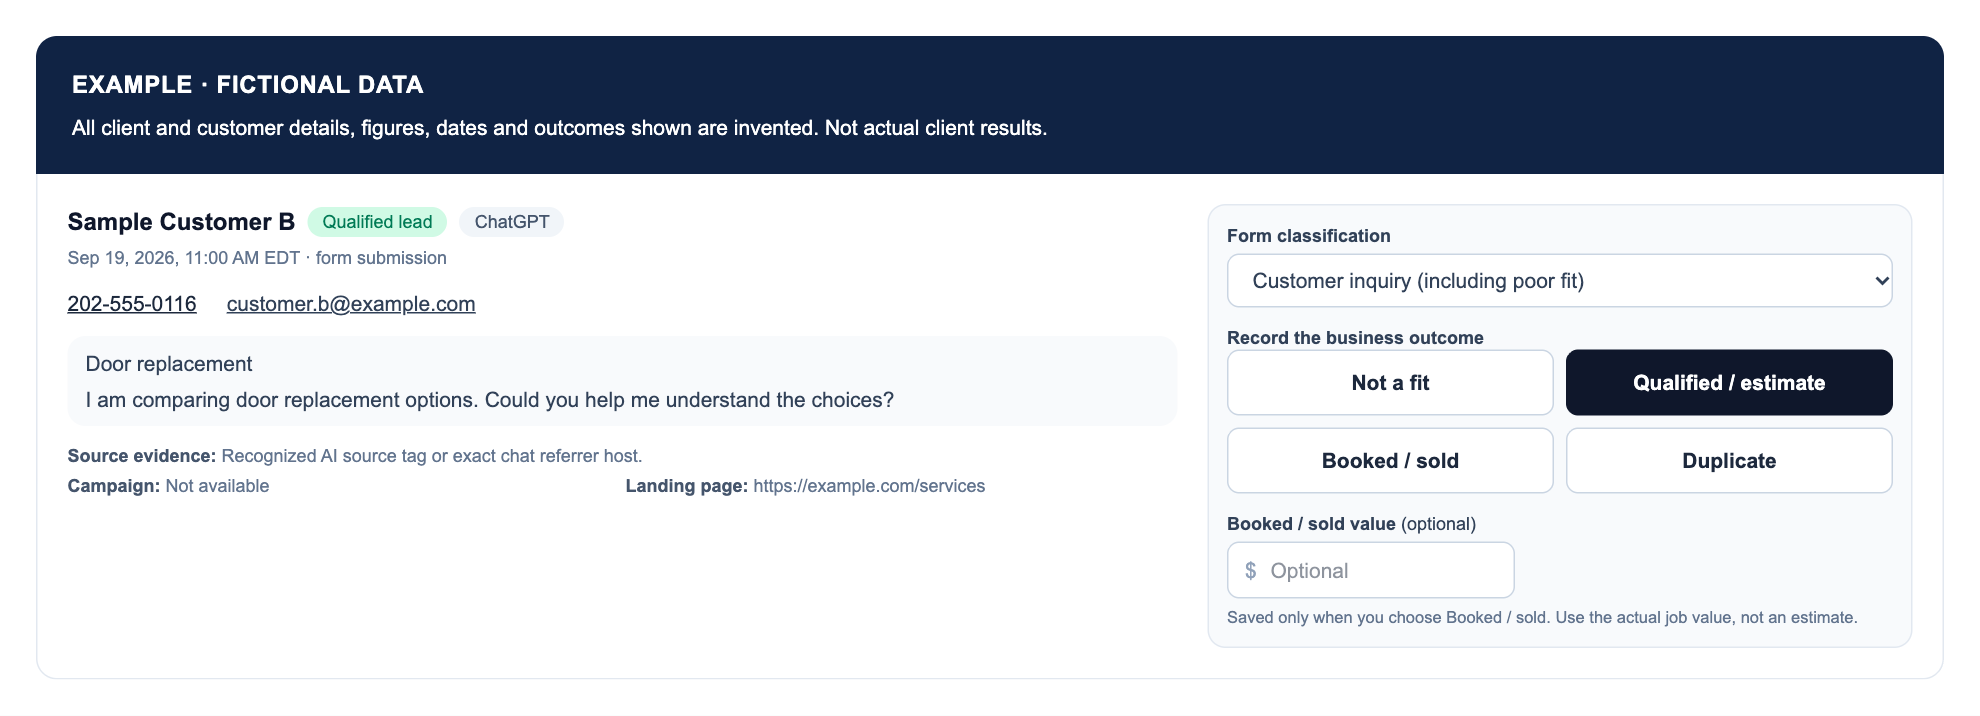
Your monthly report shows measurable ChatGPT visits, attributable inquiries, phone and text-link clicks, and the pages those visits started on. Caught also supports Claude, Gemini and Grok referral analysis in its reporting workspace, which I can review with you. Missing referral details can hide a source; private AI conversations are not available.
Your website’s health & completed work
See the latest website-check date and findings, such as whether the site was online, its connection was secure and broken links were found on the pages checked. Completed website and advertising changes can appear as a dated record, giving you visibility into the work behind the report.
A clear focus for the next month
The report closes with practical priorities for your business. I explain the findings and next steps in plain English, and you can email me directly to discuss them. Each source includes its coverage date so you know what period the figures describe.
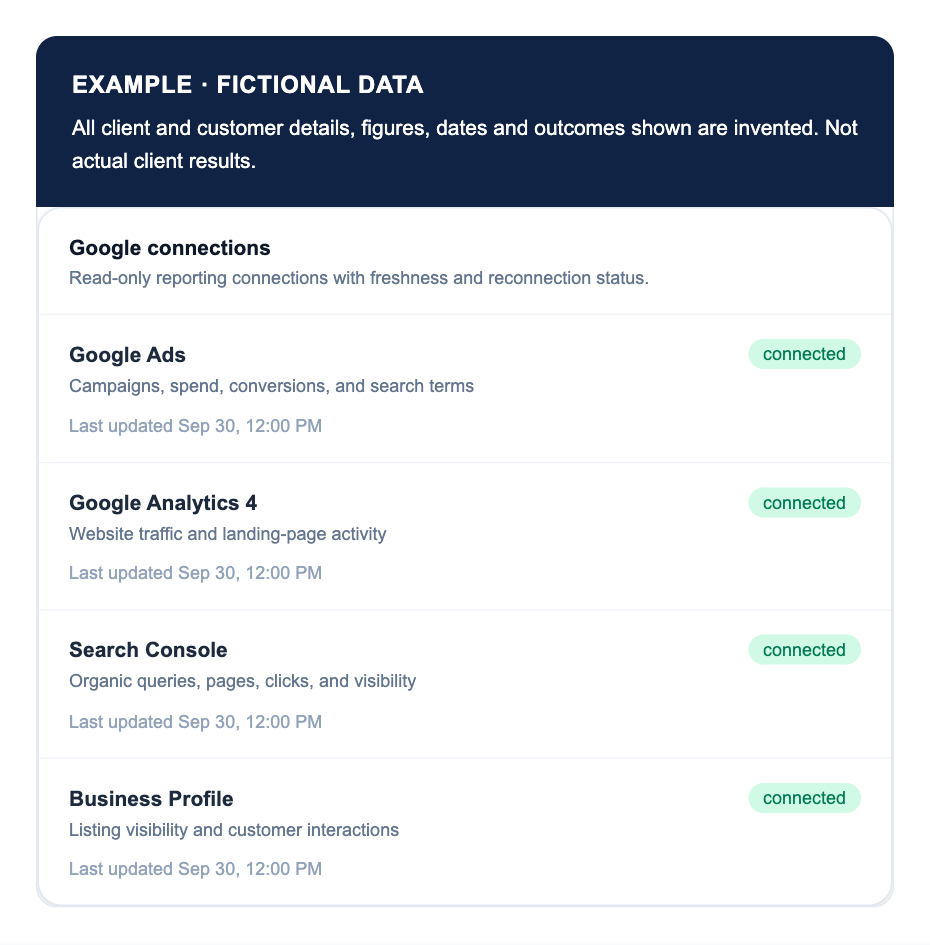
Reporting uses connected accounts and available tracking. Some searches, locations and referral sources are withheld or unidentifiable. Clicks, inquiries and confirmed sales remain separate.